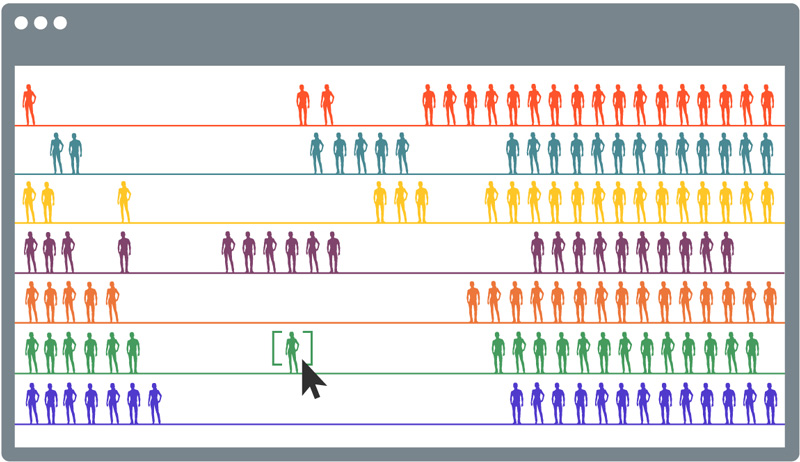
For membership organisations, membership acquisition and retention is always going to be central to business operations. Organisations work incredibly hard to acquire members, be they businesses or individuals through word of mouth or reputation, or outbound marketing. So what happens when it comes round to annual renewals and all of a sudden a large percentage of the membership fail to renew?
Retention and acquisition of membership is clearly tethered to value proposition and both the physical and metaphysical offerings of the organisations. Whilst some organisations may have a clear understanding of how they offer value to their membership, to others, it may be entirely unclear.
Over the next few months, we will be looking at methods of building value in to a membership or subscription offering, but before we do, an insight in to proactive retention can provide us with some background as to what a value proposition may become.

Back the original question, and to build up some further context: how can membership organisations use technology to proactively understand retention?
First, let’s make some all-important digital assumptions to build up a hypothetical membership scenario:
• The membership organisation digital strategy includes a website with user profiles to allow for their members to login.
• The login area contains content that adds some form of value in return for the membership fee.
• Members can change their account information, marketing preferences and pay their fees.
Next, let’s assume the worst has happened and a percentage of the membership has disappeared in to the ether.
Whilst it is normal for digital transformation consultants to assume the above tech benefits are already in place, there is also a high percentage of smaller organisations that may not benefit from these elements to maintain their membership.
Nowadays business intelligence platforms and management information are not the sole proviso of large enterprises with vast quantities of data to crunch.
Taking our first assumption as a starting point, let’s consider a KPI. To retain members, it is safe to say that they should be served with valuable content – white papers, IP, industry-specific metrics etc – and to get access to them, they need to login to your website, and indeed, understand that they can and need to do that in the first place. So with this in mind, an example KPI for the membership website would be to have over 80% of all members logging in to the website once a month.
But where has this 80% come from and what does it mean? For the purpose of this example, it represents an engagement level for ‘break even’, or in other words, 100% membership retention.
Let’s make some more assumptions to paint a prettier picture:
• The membership login has been active on the website for 36 months since January 2014 and Google Analytics, free traffic monitoring from your friend and mine, has been installed.
• The membership renewal is annual, every May, at the beginning of the new financial year.
• Our annual accounts show us that in 2013, the organisation had 75 members; 2014, the organisation had 100 members; in 2015, had 120; in 2016, membership dropped to 95; and in 2017, dropped further to 75 members.
To build out the scenario further. Over the last 5 annual periods, Google Analytics, has been collecting data on how users have been traversing the site. Unfortunately, or fortunately, depending on how you see it, some people live in fear of numerical and metrical data, or perhaps it is simply not part of your job.
This is where data visualisation comes in.
Using data visualisation through Microsoft Power Bi or Tableau, using Google Analytics as a data source, data can be plumbed in to a graphic interface providing users with easily digestible graphs of specific scenarios that may effect their membership. In a matter of hours, a dashboard can be setup which through using interactive charts, will colourfully and quickly show some conclusions.
Our conclusions could be:
The growth of membership can be correlated to the launch of a secure membership area with value-added content. This became a selling point and the amount of member login actions grew respectively.
However, as the initial impetus and value behind the digital membership area started to wain (perhaps through a lack of new content being published – a costly resource to maintain, and the increased normalisation of the function – the value is a given?), the volume of logins dropped and shows a clear correlation against the decline in member numbers.
Let’s be clear, the message from this scenario is that digital engagement i.e. the process and facilitation of login, can certainly be a factor affecting membership retention, but is not by any means the main or sole factor. We are using them to illustrate the technical options, and moreover, how intelligible data visualisation can be.
Simply put, mining this data can be straightforward and intuitive, and through data visualisation software membership organisations, be they big or small, can gain valuable insight in to their members.